Breakeven Analysis Calculator Template
Before launching a new product or expanding an existing business, it is important to determine whether the expected sales will be sufficient to cover all costs. A Breakeven Analysis Calculator helps businesses estimate the point at which total revenue equals total expenses. This information allows business owners and entrepreneurs to evaluate the financial feasibility of a product, set realistic sales targets, and make informed business decisions.
A breakeven analysis is one of the most commonly used financial planning techniques. It helps identify the minimum number of units that must be sold before a business begins generating a profit. By understanding the relationship between selling price, variable costs, fixed costs, and sales volume, businesses can better manage their operations and profitability.
What is a Breakeven Analysis Calculator?
A Breakeven Analysis Calculator is a financial tool used to determine the breakeven point of a product or business activity. The breakeven point is the level of sales at which total revenue exactly equals total costs, resulting in neither a profit nor a loss.
The calculator requires information such as the selling price per unit, variable costs per unit, and fixed operating costs. Based on these values, it automatically calculates the number of units that must be sold to recover all expenses.
This type of analysis is widely used in business planning, pricing strategies, budgeting, product development, and investment decisions. It provides valuable insight into how changes in costs or selling prices can affect profitability.
Why is Breakeven Analysis Important?
Breakeven analysis helps businesses:
- Determine whether a product is financially viable.
- Set realistic sales targets.
- Evaluate pricing strategies.
- Understand the impact of fixed and variable costs.
- Reduce financial risk before making investments.
- Support budgeting and business planning decisions.
Knowing the breakeven point enables managers to make more informed decisions and identify opportunities to improve profitability.
Main Purpose of Using a Breakeven Analysis Calculator
The primary purpose of a Breakeven Analysis Calculator is to identify the sales volume required to cover all business costs. Every business incurs fixed costs such as rent, insurance, and administrative expenses, along with variable costs that increase as production grows.
By calculating the breakeven point, a company can determine how many units must be sold before profits begin to accumulate. This information is essential when introducing new products, evaluating business opportunities, or preparing financial forecasts.
About Our Breakeven Analysis Calculator Template
Our team has created a ready-to-use Breakeven Analysis Calculator in Microsoft Excel that simplifies the entire calculation process. The template contains built-in formulas that automatically perform all required calculations once the necessary cost and sales information is entered.
The spreadsheet is designed to be simple, accurate, and user-friendly, making it suitable for small businesses, startups, retailers, online stores, and entrepreneurs who need quick profitability estimates without performing complex manual calculations.
Functionality of the Template
The template consists of a single worksheet titled “Breakeven Analysis”, where users enter sales and cost information and instantly receive breakeven results.
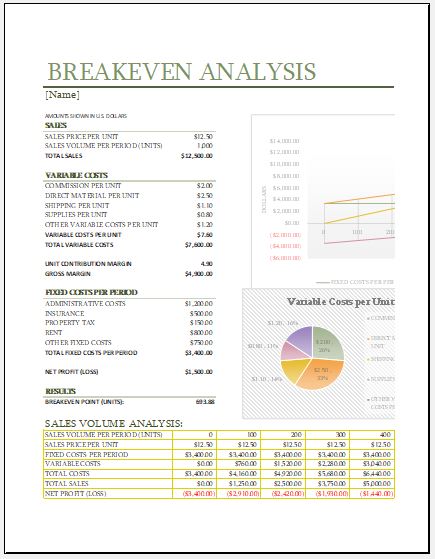
Sales Section
In the sales area, users enter:
- Sales Price per Unit
- Sales Volume per Period
Based on these values, the template automatically calculates:
- Total Sales Revenue
Variable Costs Section
The template allows users to record several variable cost categories, including:
- Commission per Unit
- Direct Material Cost per Unit
- Shipping Cost per Unit
- Supplies Cost per Unit
- Other Variable Costs per Unit
The worksheet automatically calculates:
- Total Variable Cost per Unit
- Total Variable Costs
Contribution Margin Calculation
The template calculates the Unit Contribution Margin, which represents the amount contributed by each unit sold toward covering fixed costs and generating profit.
It also calculates the Gross Margin by subtracting total variable costs from total sales revenue.
Fixed Costs Section
Users can enter major fixed expenses such as:
- Administrative Costs
- Insurance
- Property Tax
- Rent
- Other Fixed Costs
The template automatically totals all fixed expenses to determine the Total Fixed Costs per Period.
Profit Calculation
Using the gross margin and fixed costs, the spreadsheet calculates the business’s:
- Net Profit (Loss)
This allows users to immediately see whether the projected sales volume results in a profit or a loss.
Breakeven Point Calculation
One of the most important features of the template is the automatic calculation of the:
- Breakeven Point (Units)
This value shows exactly how many units must be sold before all costs are covered and the business reaches a zero-profit, zero-loss position.
Sales Volume Analysis
The template also includes a detailed Sales Volume Analysis section.
This section automatically analyzes multiple sales volume levels ranging from 0% to 100% of the projected sales volume. For each level, the spreadsheet calculates:
- Total Variable Costs
- Total Costs
- Total Sales Revenue
- Net Profit or Loss
This feature allows users to evaluate how profits change as sales volume increases or decreases.
Conclusion
A Breakeven Analysis Calculator is an essential financial planning tool for businesses of all sizes. It helps determine the minimum sales required to cover costs, evaluate profitability, and reduce financial uncertainty. Our Excel-based Breakeven Analysis Calculator automates all calculations, provides instant results, and includes sales volume analysis to support better business planning and decision-making. Whether you are launching a new product or evaluating an existing one, this template offers a quick and reliable way to understand your breakeven point and profitability potential.
Format: Microsoft Excel
File Size: 33 KB
- Children’s Daily Activity Reward Sheet
- Winter Clothing & Gear Budget Sheet
- Winter Utility Expense Template
- Fuel & Equipment Sheets
- Monthly Attendance Sheet for Employees
- Student Entry & Exit Log
- Gantt Chart for Smaller Projects
- Behavior Log of Child for Schools
- Loan Repayment Tracker
- Product Sales Tracker Template
- Debit Memo Template for Excel
- Winter Attire Inventory
- Financial Projections Worksheet
- Employee Absence Tracker
- Weekly Sales Report Template
← Previous Article
Monthly College Expense CalculatorNext Article →
Problem Analysis Template