Detailed Sales Forecast Template
Sales forecasts play a very important role in any business. Not only for the business but it is also needed when you want to get a loan from any bank or any investor. Sales are the most vital component of any type of business, but they are more important for the business that is related to the products.
In the process of selling, different companies sell their manufactured goods to their customers and get a profit in return. The profit earned completely depends on the sales of the company. To enhance sales, a company is required to have increased revenue.
Some different methods and techniques are being applied by businesses these days to boost their sales and get maximum revenue.
Using a detailed sales forecast template is also one of those methods. The contents of the template enable the person to plan, implement, assess, and control the sales program of the company when a company learns about future sales in advance.
The forecast can be of different types, i.e., monthly or yearly. The multiple products and services can be compared and analyzed by entering the number of units sold in a month, the price of one unit, and the cost of goods and services.
The template is available free of charge. You can easily customize it according to your needs and requirements. The template’s contents depend on the forecast you want to make for your business’s sales. Important sections of this worksheet are described below.
Forecast Input:
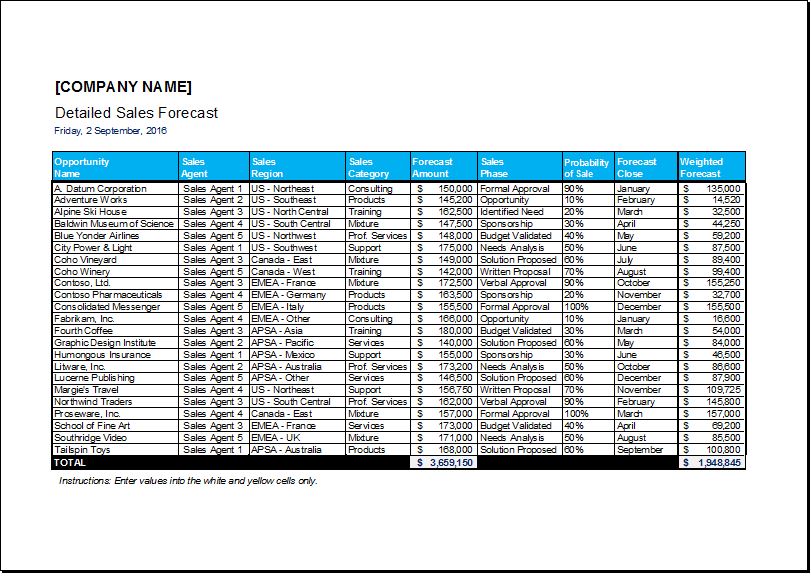
This is sheet # 1 of the template named forecast input. This sheet contains information regarding different sales opportunities with a weighted forecast. It includes different information, such as
- Opportunity: It may contain a business or organization name which is involved in the business.
- Sales region: It is good to analyze sales regions, and this information is very vital to making plans.
- Sales category: It includes consulting, products, training, mixtures, professional services, support, etc.
- Forecast amount: The amount that can be forecasted for a particular sale.
- Sales phase: It includes formal approval, opportunity, identified need budget validation, etc.
- The probability of sale: is the percentage number that shows the numeric presentation of sales probability.
- Forecast close: If the sales forecasting is being done every month, enter a month’s name.
Enter all the relevant information, and the sheet will calculate for you a total of the forecasted amount along with a weighted forecast. See the screenshot below to understand in detail.
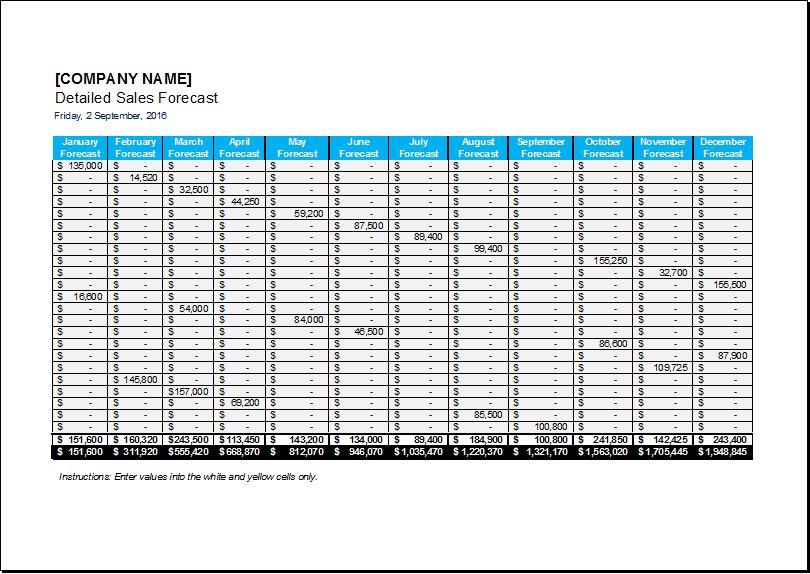
Forecast Totals:
This is sheet #2 of the template named Forecast Totals. This sheet holds information for sales forecast totals for each month in a year. This sheet is editable, but it is strongly advised not to alter any cell as it contains formulas to perform different functions. This sheet is more like an output for the forecasted sales relevant to each month.
Forecast Graph:
This is sheet #3 of the template named Forecast Graph. It contains a graph that represents a relationship between monthly weighted forecasts and forecast revenue.
- Student Entry & Exit Log
- Gantt Chart for Smaller Projects
- Behavior Log of Child for Schools
- Loan Repayment Tracker
- Product Sales Tracker Template
- Debit Memo Template for Excel
- Winter Attire Inventory
- Financial Projections Worksheet
- Employee Absence Tracker
- Weekly Sales Report Template
- Budget Vs Actual Statement
- Remote Work Attendance Tracker
- Mileage Expense Report Template
- Fitness Calendar Template
- Project Gantt Chart
← Previous Article
Detailed and Quarterly Leads TrackerNext Article →
Customer Portfolio & Profitability Analysis Sheet


Leave a Reply