Problem Analysis Template
All of us sometimes come across situations where we feel the need to perform analytical tasks to better understand the problems we are facing. The main purpose of problem analysis is to identify the root cause of an issue. In this way, organizations can solve problems more effectively and efficiently.
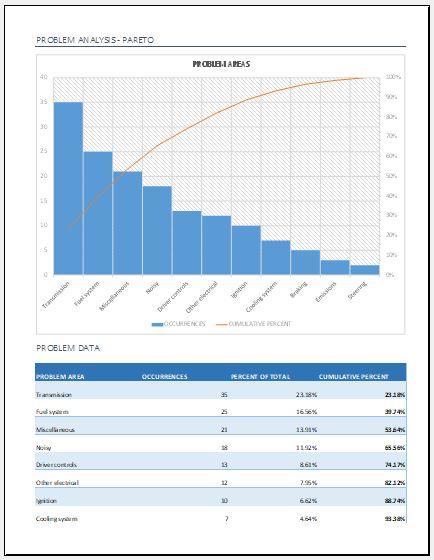
Problem analysis defines the method by which a problem is identified, examined, and resolved. It can be performed using different techniques. One commonly used approach is data visualization through graphs. A graph helps identify flaws with a clearer visual representation. In MS Excel, a Pareto Chart is often used for this purpose.
What is a Pareto Chart?
A Pareto Chart is a type of bar graph in which data is represented in descending order. The length of each bar indicates frequency, cost, time, or another relevant measure. The longest bars appear on the left, while the shortest appear on the right. This arrangement visually highlights the most significant factors in a process.
Understanding Pareto Analysis
Pareto Analysis is a quantitative decision-making technique used to identify a limited number of causes that produce the most significant overall effect. It is based on the Pareto Principle, commonly known as the 80/20 rule.
According to this principle, roughly 80% of results come from 20% of causes. In other words, by focusing on a small number of key issues, you can achieve the majority of the desired improvement.
When to Use Pareto Analysis
Pareto Analysis is useful in the following situations:
- When analyzing data related to the frequency of problems in a process
- When multiple issues exist and you need to prioritize the most important ones
- When examining major causes by breaking them into specific components
- When communicating findings clearly with others using data
Steps to Create a Pareto Chart
- Select the categories in which you will group the data
- Decide the appropriate measurement type (e.g., quantity, frequency, time, or cost)
- Define the time period for data collection (e.g., one day, one week, or one production cycle)
- Collect and record data for each category consistently
- Sum the values for all categories
- Arrange the categories on a suitable scale
- Plot bar graphs for each category
- Calculate the percentage contribution of each category
- Compute cumulative values and display them on the chart
Before diving into specific tools and techniques, it is important to understand how complex problems can be organized in a structured way. A clear framework helps break down issues into manageable parts, making it easier to identify causes, evaluate impacts, and decide on effective solutions. This is where a problem analysis template becomes a valuable tool for systematic thinking and decision-making.
What is a Problem Analysis Template?
A problem analysis template is a structured tool used to examine problems in detail in order to understand their causes and consequences. It guides users step by step toward meaningful results that can support better decision-making in the future.
This template helps users understand information more clearly by presenting it in a structured and often visual format, such as diagrams. It is also flexible, allowing customization based on specific needs.
Key Components of the Template
A problem analysis template typically includes:
- A timeline describing when the problem started and its consequences
- The strategies used to solve the problem
- Details of the team responsible for the analysis
- Results obtained from the analysis process
- Recommended actions to resolve current issues and prevent future occurrences
Benefits of Using a Problem Analysis Template
- Clearly defines all aspects of the problem
- Helps in developing effective solutions
- Ensures a smooth and organized analysis process
- Supports strategic decision-making
- Allows multiple approaches for solving complex issues
Format: Microsoft Excel (.xlsx)
File Size: 23 KB
- Children’s Daily Activity Reward Sheet
- Winter Clothing & Gear Budget Sheet
- Winter Utility Expense Template
- Fuel & Equipment Sheets
- Monthly Attendance Sheet for Employees
- Student Entry & Exit Log
- Gantt Chart for Smaller Projects
- Behavior Log of Child for Schools
- Loan Repayment Tracker
- Product Sales Tracker Template
- Debit Memo Template for Excel
- Winter Attire Inventory
- Financial Projections Worksheet
- Employee Absence Tracker
- Weekly Sales Report Template
← Previous Article
Breakeven Analysis Calculator TemplateNext Article →
Hourly Paycheck Calculator Template