Sales Forecast Template
Sales forecasts play a crucial role in every business. They are not only essential for effective business management but are also important when applying for bank loans or seeking investment from potential investors. Sales are a core component of any business, particularly for product-based businesses where revenue depends directly on sales performance.
In the process of selling, companies offer their products or services to customers and generate revenue in return. The level of profit a company earns largely depends on its sales performance. To increase profitability, a company must focus on improving its revenue through effective sales planning and forecasting.
Nowadays, businesses use various strategies and techniques to increase sales and maximize revenue.
One effective approach is using a Sales Forecast Template. This template helps businesses plan, implement, monitor, and control their sales programs by providing insights into expected future sales. By forecasting sales in advance, companies can make informed decisions and allocate resources more efficiently.
The sales forecast can be prepared for different periods, such as monthly or yearly. Multiple products or services can be compared and analyzed by entering the projected number of units sold per month, the price per unit, and the cost of goods or services.
This template is available free of charge and can be easily customized to meet your specific business needs. Its structure and contents may vary depending on the type of sales forecast you intend to prepare. The key sections of this worksheet are outlined below.
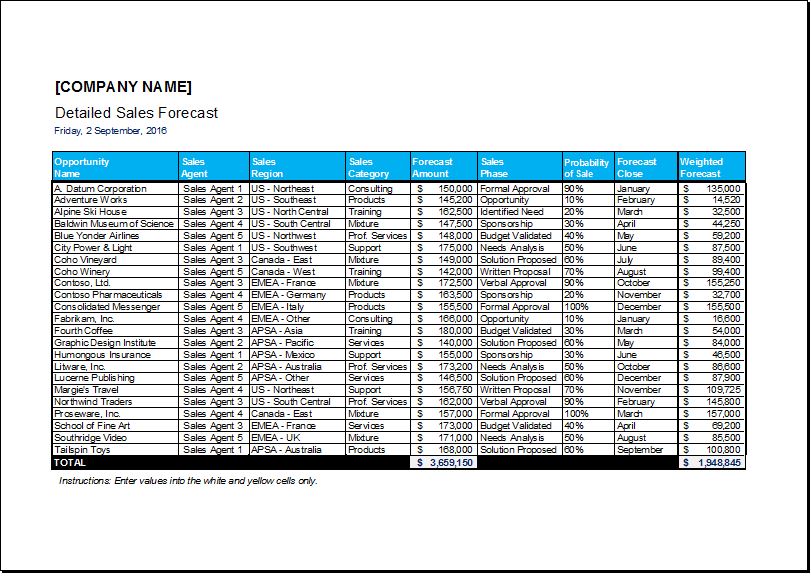
Forecast Input:
This is Sheet #1 of the template, titled “Forecast Input.” This sheet captures detailed information about potential sales opportunities and calculates a weighted sales forecast automatically.
It includes the following fields:
- Opportunity – The name of the business or organization associated with the potential sale.
- Sales Region – The geographical area where the sale is expected. Analyzing sales by region supports better strategic planning.
- Sales Category – The type of sale, such as consulting, products, training, professional services, support, or a combination of these.
- Forecast Amount – The estimated value of the potential sale.
- Sales Phase – The current stage of the sales process (e.g., opportunity identified, budget validation, formal approval, negotiation, etc.).
- Probability of Sale (%) – The estimated likelihood of closing the sale, expressed as a percentage.
- Forecast Close (Month) – If forecasting is conducted monthly, enter the expected closing month of the sale.
After entering all relevant information, the sheet automatically calculates:
- The Total Forecasted Amount
- The Weighted Forecast (Forecast Amount × Probability of Sale)
Enter all the relevant information, and the sheet will automatically calculate the total forecasted amount along with a weighted forecast. Refer to the screenshot below for a detailed example.
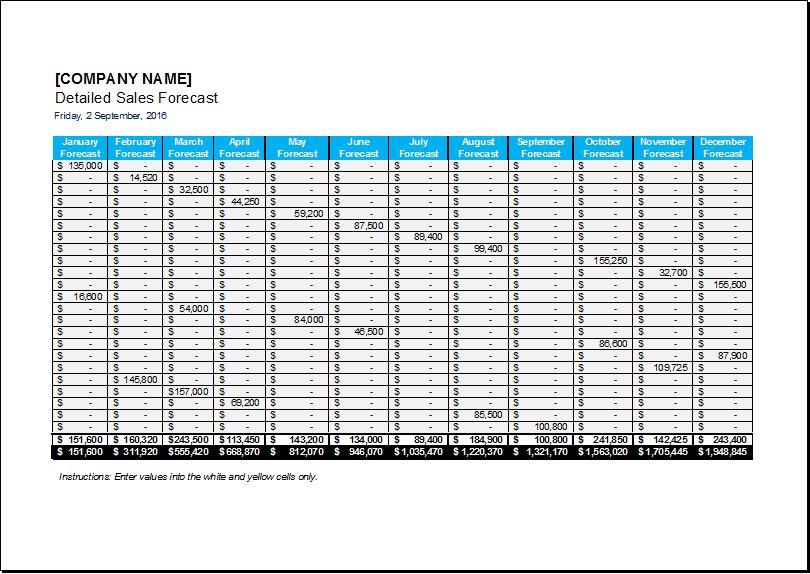
Forecast Totals:
This is Sheet #2 of the template, titled “Forecast Totals.” It summarizes the total sales forecast for each month of the year. Although the sheet is editable, it is strongly recommended not to modify any cells, as they contain formulas that perform essential calculations. This sheet primarily serves as an output page, displaying the consolidated monthly forecasted sales figures.
Forecast Graph:
This is Sheet #3 of the template, titled “Forecast Graph.” It includes a chart that illustrates the relationship between monthly weighted forecasts and forecasted revenue.

- Children’s Daily Activity Reward Sheet
- Winter Clothing & Gear Budget Sheet
- Winter Utility Expense Template
- Fuel & Equipment Sheets
- Monthly Attendance Sheet for Employees
- Student Entry & Exit Log
- Gantt Chart for Smaller Projects
- Behavior Log of Child for Schools
- Loan Repayment Tracker
- Product Sales Tracker Template
- Debit Memo Template for Excel
- Winter Attire Inventory
- Financial Projections Worksheet
- Employee Absence Tracker
- Weekly Sales Report Template
← Previous Article
Detailed and Quarterly Leads TrackerNext Article →
Customer Portfolio & Profitability Analysis Sheet
Leave a Reply