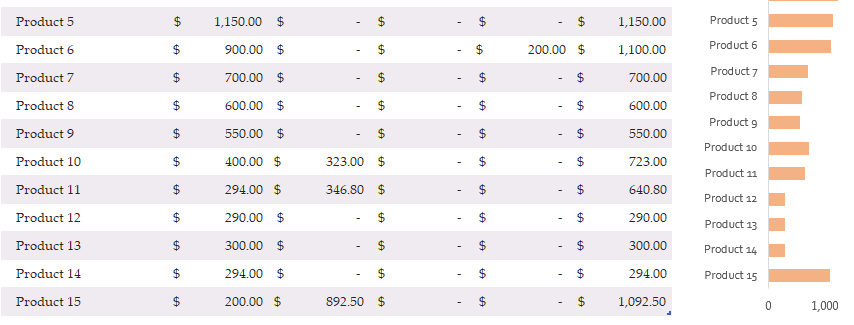
Quarterly Sales Report Sheet
Usually, for an organization, the main source of income is its sales. Hence, keeping a track of sales for specified periods is very important for its success and continuance as a business. Often, a year is divided into four quarters for analysis purposes, and the sales and cost figures are recorded accordingly. When decisions are to be made to constantly improve sales scenarios during a year, the sales are assessed and recorded in a quarterly sales report sheet.
What is a quarterly sales report sheet?
A quarterly sales report sheet is an Excel worksheet, which records the sales of a quarter. The sales figures indicate the income, that is being generated by an organization over the months and quarters. The sales are recorded on a monthly basis and analyzed on a quarterly basis. This sheet indicates the increase/decrease in the sales over the quarter. In addition, quarterly sales are used to make future plans, devise strategies, and compete in the market.
What are the advantages of a quarterly sales report sheet?
This report has many advantages, a few of which are:
Helps in analyzing quarterly sales:
This sheet gives an overview of the sales over a quarter, which can be used to analyze the income scenario and the standing of the organization. For instance, if the sales are rising, it may indicate an increasing number of customers. On the contrary, another example could be a rising selling price, but decreasing number of units sold. It might indicate rising sales figures, but the breakdown present in the worksheet would tell the users that the organization may be losing customers due to its rising price.
Aids in devising strategies:
The key performance indicators (KPIs) generated through this sheet can be used to strategize for future periods. For instance, if a product is continuously experiencing decreasing sales, it may mean that its lifecycle is ending, or it requires further advertising and marketing to attract customers. Hence, the strategies can be devised, and tactics can be adopted, by using the data in this sheet.
Administers automatic calculations:
The Excel sheet has in-built formulas, which makes the calculations easier. The user can insert the data, and the calculations will be done automatically. This not only saves time but also, saves the hassle and reduces the chances of error. In addition, the sheet generates the percentages and graphs, that can be used for analysis purposes.
What are the main components of a quarterly sales report sheet?
Generally, the following components are recorded in such a sheet:
- Title.
- Year.
- Quarter months and dates.
- Units sold.
- Price of each unit.
- Sales of each month.
- Sales from unusual sources.
- Total sales of the quarter.
- Growth in sales from one quarter to another.
- Other key performance indicators (KPIs), such as percentage of sales of each product, sales per area per quarter, etc.
However, these components can be altered or added into, as per the requirement of the user and auditors.
Provided by: https://templates.office.com/
← Previous Article
Vacation and Sick Time Tracking WorksheetNext Article →
CD Switch Analysis Sheet