Quarterly Sales Report
Most businesses use quarterly sales reports to analyze their business. A sales report gives an overview of the sales activities within a company. It shows different trends in sales in different periods. At the end of every quarter, all the sales representatives along with their sales managers meet and give their reports on their sales and earnings individually.
A quarterly sales report means that the sales and earnings of a business are analyzed after every three months. Thus in one single year, a company analyzes its sales four times.
Sale is related to the number of items to be sold in a given period. The items in the sale include:
- Finished products directly to the clients.
- Raw materials for further processing.
Thus, a sale is a transaction of goods between two parties, where one party sells and the other buys.
A company hires sales representatives to sell its products via emails, personal meetups, or telephone calls. The sales manager monitors the activities and target achievement of these sales representatives. The company awards individuals with the highest number of sales in the form of a bonus.
Structure of a quarterly sales report:
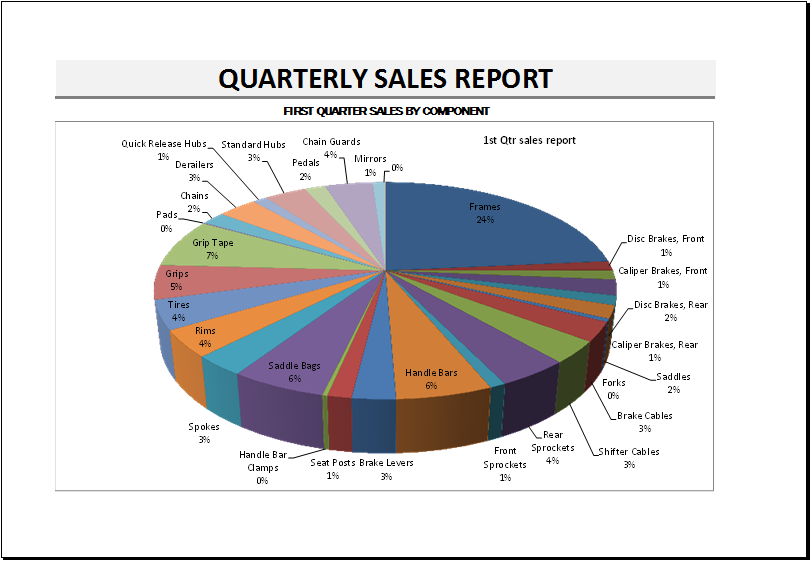
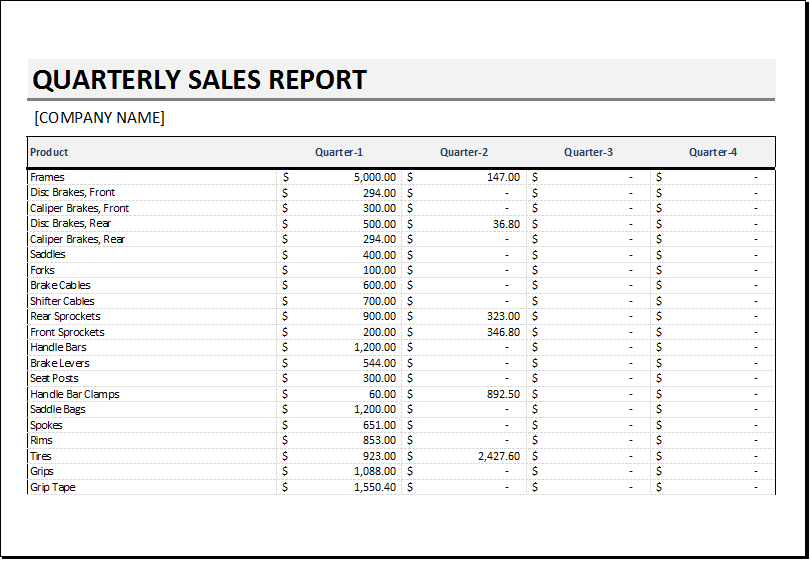
Quarterly sales report records and displays multiple products with quarterly sales by the sales team. The report can also be in the form of a pie chart. The results are automatically displayed in the chart as every sales individual maintains and updates his number of sales daily in the report. The data can be easily accessed at the time of audit and can be presented in PowerPoint in meetings.
Before the introduction of computerized sales reports, companies used to record, maintain, and search for sales manually. The process was hectic and tiring. Tracking down the sales of different products, from different outlets of the same business is not easy. Online software for recording the actual sales over some time, made it easy both for the sales representatives and the managers. Using a daily, weekly, monthly, or quarterly sales report with the sales teams is an important action to increase the performance of individuals.
A quarterly sales report gives more time for sales and reduces pressure on the team. It analyzes the sales funnel and determines the best decision to be implemented and the best action to be taken.
Sales Reports
A sales report is the most important report of a company. It shows the performance of the company. The results related to the sales volume and changing trends in sales volume in three months are included in the quarterly sales report.
A quarterly sales report tells about the company if its sales are increasing or decreasing. You can analyze the quarterly reports in any part of the quarter to check the performance of the company and how it will perform in the future. It also helps the manager in making the decision and formulating a plan to enhance the performance of the company.
Quarterly sales
The quarterly sales report is prepared in Excel. It provides all the tools that a person can get for business analysis. This sheet helps the person check the weaknesses that his business has and also those aspects that require improvement. The quarterly performance of the company is tracked by the owner of the company and he can work hard to improve his business by providing the best services to the customers.
Those companies, who also want to keep track of their customers and products can also use this report. This template can be downloaded from the internet free of cost. It is very easy to use. The person is just required to input the desired data and it will generate the report automatically.
The businessman can get the idea of his loss and profit which he has faced in the whole quarter.
Quarterly sales report template
Download your file below. File Size: 48 KB
- Children’s Daily Activity Reward Sheet
- Winter Clothing & Gear Budget Sheet
- Winter Utility Expense Template
- Fuel & Equipment Sheets
- Monthly Attendance Sheet for Employees
- Student Entry & Exit Log
- Gantt Chart for Smaller Projects
- Behavior Log of Child for Schools
- Loan Repayment Tracker
- Product Sales Tracker Template
- Debit Memo Template for Excel
- Winter Attire Inventory
- Financial Projections Worksheet
- Employee Absence Tracker
- Weekly Sales Report Template
← Previous Article
Expense Claim FormNext Article →
Home Renovation Model Sheet