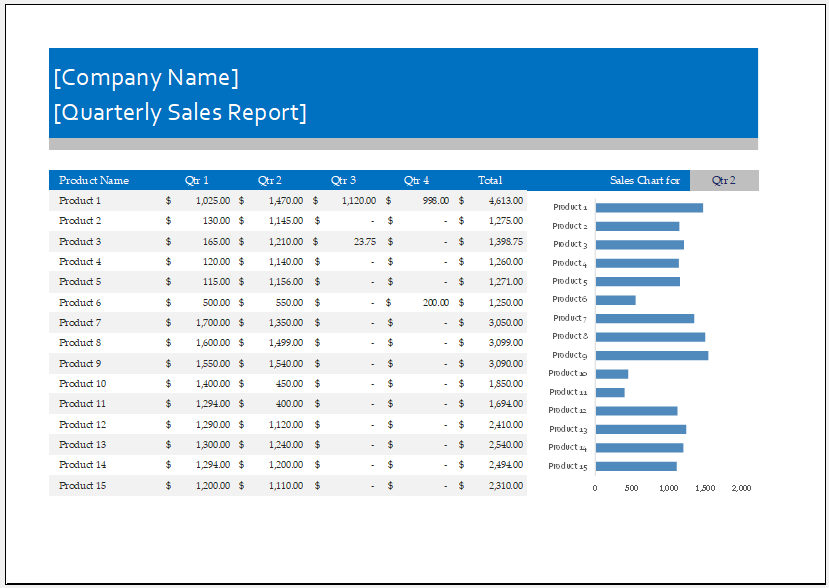
Quarterly Sales Report Worksheet with Graphs
Measuring performance is an important part of an organization because this is one of the main tasks every company focusing on success wants to do. Companies generally measure performance using different parameters. Checking in on the sales conducted by a company in a specific period is very helpful.
A sales report is a document that includes qualitative as well as quantitative data that helps a business in successful evaluation. This report is very useful for determining the performance of the sales team a company has employed for conducting sales. A quarterly report includes the data for 4 months only.
Any organization wanting to keep track of its performance never finds it practical to check the sales daily. This is because everyone knows that nothing changes overnight and things take time. After a quarter of a year has elapsed, the data can be collected and the report can be formulated.
Using the worksheet:
A worksheet of the quarterly sales report is a tool that helps collect the data required for the evaluation of quarterly sales. This worksheet has plenty of options to demonstrate the data and sales performance in the form of tables and graphs.
The worksheet collects data to generate a report
The worksheet is the best way to collect the required data and store it until the complete report is generated. It has various empty fields that are filled by the user. Even a user with no prior experience can generate the report with ease and flexibility.
Worksheet for many reasons
The reason why many companies have embarked upon using the worksheet for performance evaluation is the benefits they reap. Let us see some of them:
It enables a company to see growth:
The growth of a business largely depends on the number of sales it makes in a particular time period. The use of a worksheet enables a business to see how its sales grew in a period of 4 months. If there is little or no improvement, it means no progress has been made.
It evaluates the performance of the sales team:
A sales report worksheet is a perfect tool to examine the performance of the sales team. Organizations have a group of individuals who use their competence in expertise to make a business grow. However, if a sales report reveals that no improvement has been made in a quarter, it will mean that there is some problem with the employed people.
Evaluation becomes easy:
There can be different ways and tools for the evaluation of sales. The worksheet is a simple yet very useful software for performance assessment. The worksheet contains different columns ready to get the input and then it gives output in the form of the quarterly sales report.
It helps a company see data in various forms:
The output generated after the use of a worksheet is very important for a business. Future decisions are predominantly based on it. Therefore, the output is very important. This worksheet allows people to view the output in various forms such as tables and graphs which makes the assessments of the quarterly sales more accurate.
It is helpful in forecasting:
Many businesses also base their success on quarterly or yearly forecasts. The forecasts are to the point and accurate when the data they have is accurate. Since the worksheet enables a business to get useful output, forecasting sales becomes easy and trustworthy.

File Excel (.xlsx) Size: 110KB
Main features of the quarterly sales report worksheet?
A typical worksheet with graphs has the following elements:
A number of sales:
This part of the report describes how many sales have been carried out in a quarter. A complete breakdown can also be seen.
Revenue generated:
This field in the worksheet allows you to put down the total revenue generated daily in a quarter.
Profit:
Profit is another important aspect of the sales report that is also monitored through the quarterly sales report.
Sales details on monthly basis:
Since the report is used for quarterly assessment, it shows the performance of all 4 months.
Find more helpful worksheets…
- Budget Vs Actual Statement
- Remote Work Attendance Tracker
- Mileage Expense Report Template
- Fitness Calendar Template
- Project Gantt Chart
- Daily Attendance Tracker for an Individual Employee
- Overtime Hours Tracker Template
- Vacation and Leave Tracker Template
- Departmental Expense Report Template
- Event Planning Gantt Chart
- Employee Attendance Dashboard
- Monthly Study Reminder & Planner
- Move-in Checklist Template
- Camping Checklist Template
- Employee Orientation Checklist Template
← Previous Article
Volunteer Signup WorksheetNext Article →
Weight Calories and Sleep Tracker