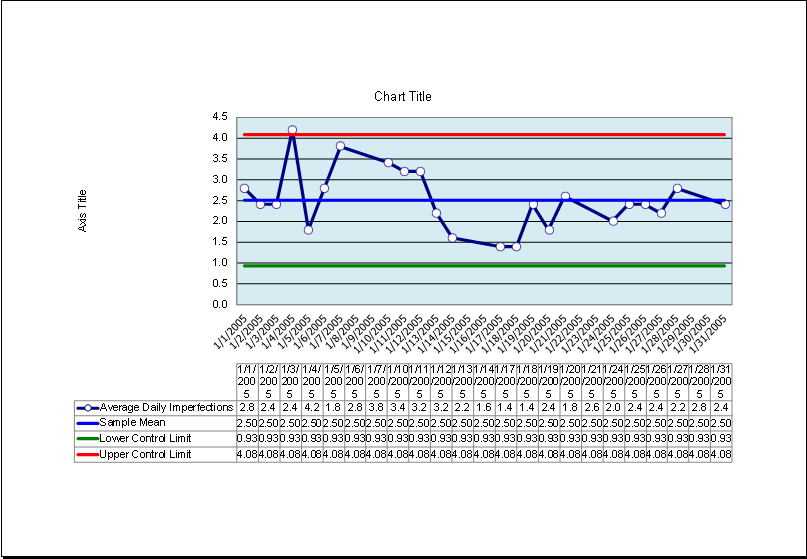
Product Quality Control Chart Sample
A quality control chart is a graphical representation of some specific type of information. This chart is used by the user to know if the quality produced by a company is meeting the standards on which it was manufactured. The quality control chart is considered useful because it also shows to what extent the product varies from the specifications it was intended to meet.
The quality control chart is prepared by analyzing some specific attributes of the product. A company manufactures several products at a time. It chooses random products for analyzing the attributes and making the quality control chart.
Quality control & presentation of charts
The control chart is one of the basic tools of quality control if you want to compare samples after the product; the type of chart used to do this is very effective.
Product quality control empowers organizations to control the data related to product quality. This minimizes product and manufacturing defects, as well as customer complaints. Many product handlers identify quality as a key factor that can distinguish their product from their competitors.
Many manufacturers follow the ISO 9000 series of standards, the international standards established by the ISO. It postulates quality requirements for the design, development, production, and sales of quality products, e.g., medicines. These standards have been adopted worldwide for quality products.
The procedure should strictly control the quality of products, beginning with the raw material inspection, product design, development stage, and even post-sales service. A chart that portrays whether sampled products or processes are meeting the standards or not.
If defects are systematically occurring in the product, then they are displayed on the chart. Different types of charts are drawn for quality control, such as X-bar charts and S-charts. These charts depend on the type of quality information that is to be controlled.
A quality control chart also illustrates whether the quality strays from one or more standards.
Types of quality control chart:
The main job of a quality control chart is to monitor the specific features of the product so that quality can be maintained. Based on the characteristics of the product, a quality chart is divided into the following types:
X-bar chart:
This type of chart is used to control the mean value of the variables. The mean values are plotted in the X-bar chart.
S-chart:
The standard deviations are plotted in the S chart. The purpose of plotting deviations is to control the variability of the variables being plotted.
R-Chart:
In the R-chart, ranges are used to plot the graph. These charts are used to control the variability of various variables.
S**2 chart:
Variances available as a sample are used to plot a graph, which is known as an S**2 chart.
Every type of product quality control chart is available as a free template online. Customize these charts to your product requirement and have a valid product quality control assessment.
Sample Template:
Maintaining the quality of the product is the basic need of a business. High-quality products are not only needed by the customers but also by the company to maintain its current customers and convert potential customers into actual customers.
There are different ways in which a company checks the quality of the product it has manufactured. The purpose of checking the quality is to ensure that the customers are satisfied. Sample quality control charts are available on different sites that give a clear idea about the making of the chart.
Preview
Download your file below.
File Size: 41 KB
- Student Entry & Exit Log
- Gantt Chart for Smaller Projects
- Behavior Log of Child for Schools
- Loan Repayment Tracker
- Product Sales Tracker Template
- Debit Memo Template for Excel
- Winter Attire Inventory
- Financial Projections Worksheet
- Employee Absence Tracker
- Weekly Sales Report Template
- Budget Vs Actual Statement
- Remote Work Attendance Tracker
- Mileage Expense Report Template
- Fitness Calendar Template
- Project Gantt Chart
← Previous Article
Home Maintenance ScheduleNext Article →
Holiday Party Planner